k-Nearest Neighbors (KNN)
DSC365: Introduction to Data Science
2026-10-22
Announcements
Mini Project 2
- Due Tonight at 11:59 in Blueline
Lab 5 (Linear Models)
- Due next Tuesday (October 27) at 11:59 pm in Blueline
Quiz 3: in class next Thursday, October 29
- Covers: Prediction/KNN/Tree-Based Methods
Source code for today’s slides – don’t forget to comment out the include_graphics lines!
Classifiers
Classification vs. Regression
A model predicts a response variable (\(y\)) from predictor variables (\(x\))
Regression: \(y\) is numeric
Classification: \(y\) is categorical
“Lazy” learning
Lazy learning: no assumptions necessary to classify data
- predicting outcomes without specifying a model
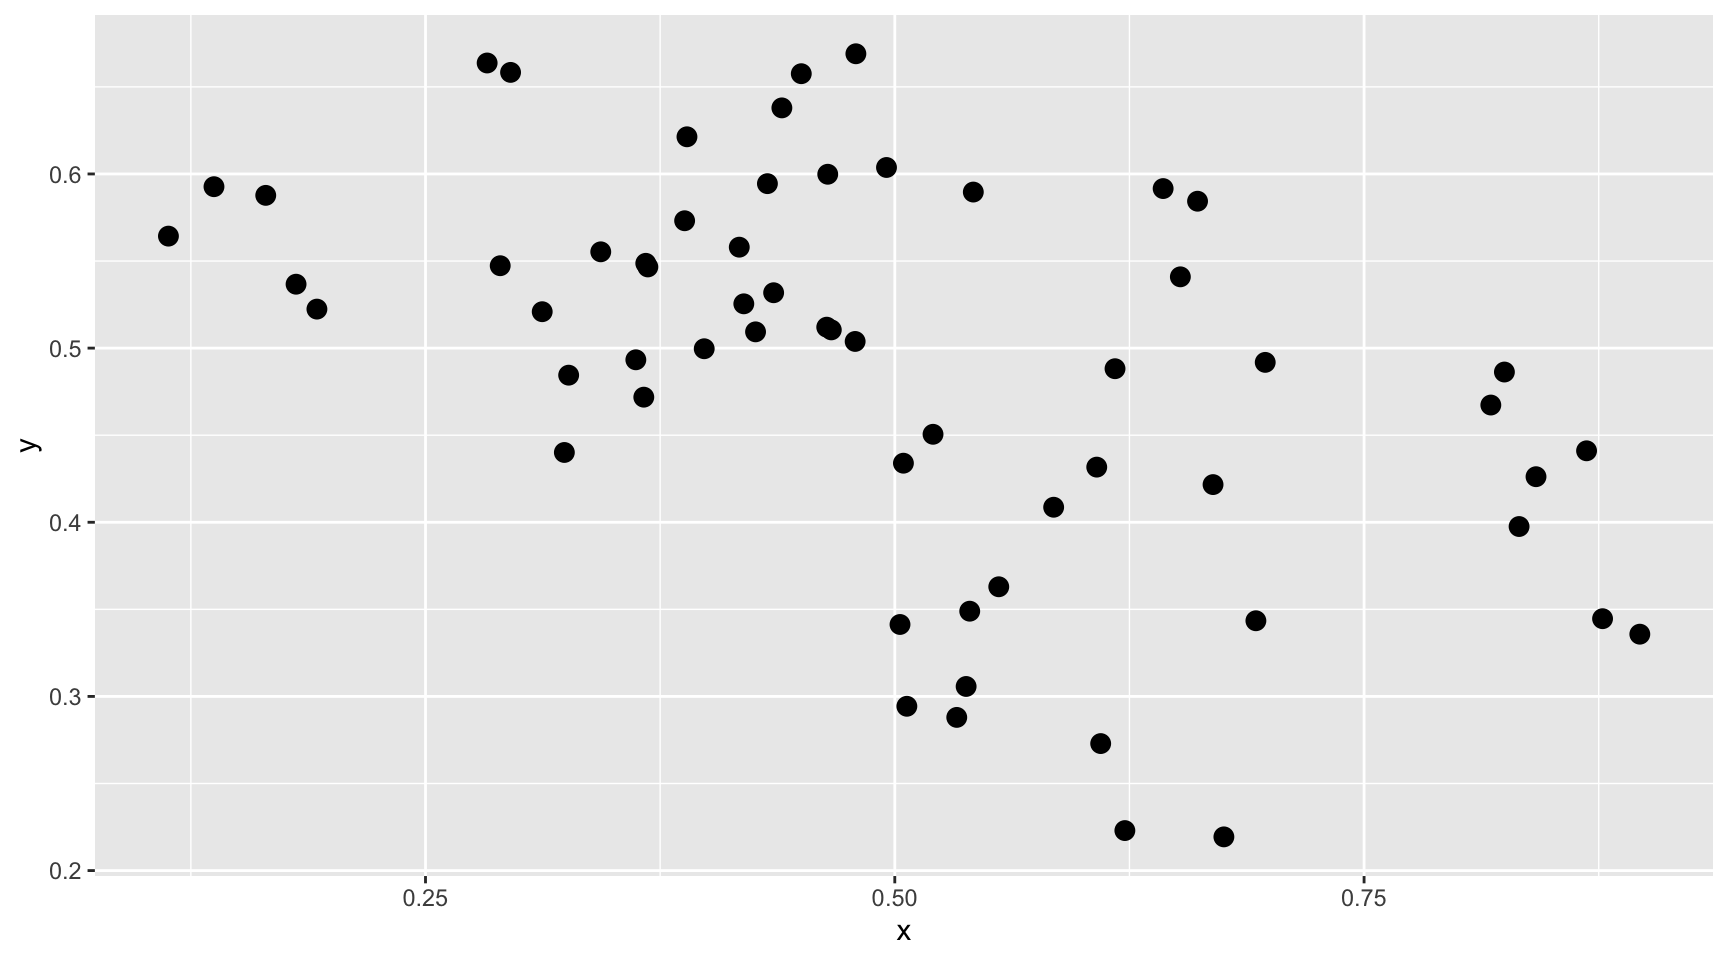
Example: Consider the plot below - describe the relationship between x and y.
“Lazy” learning
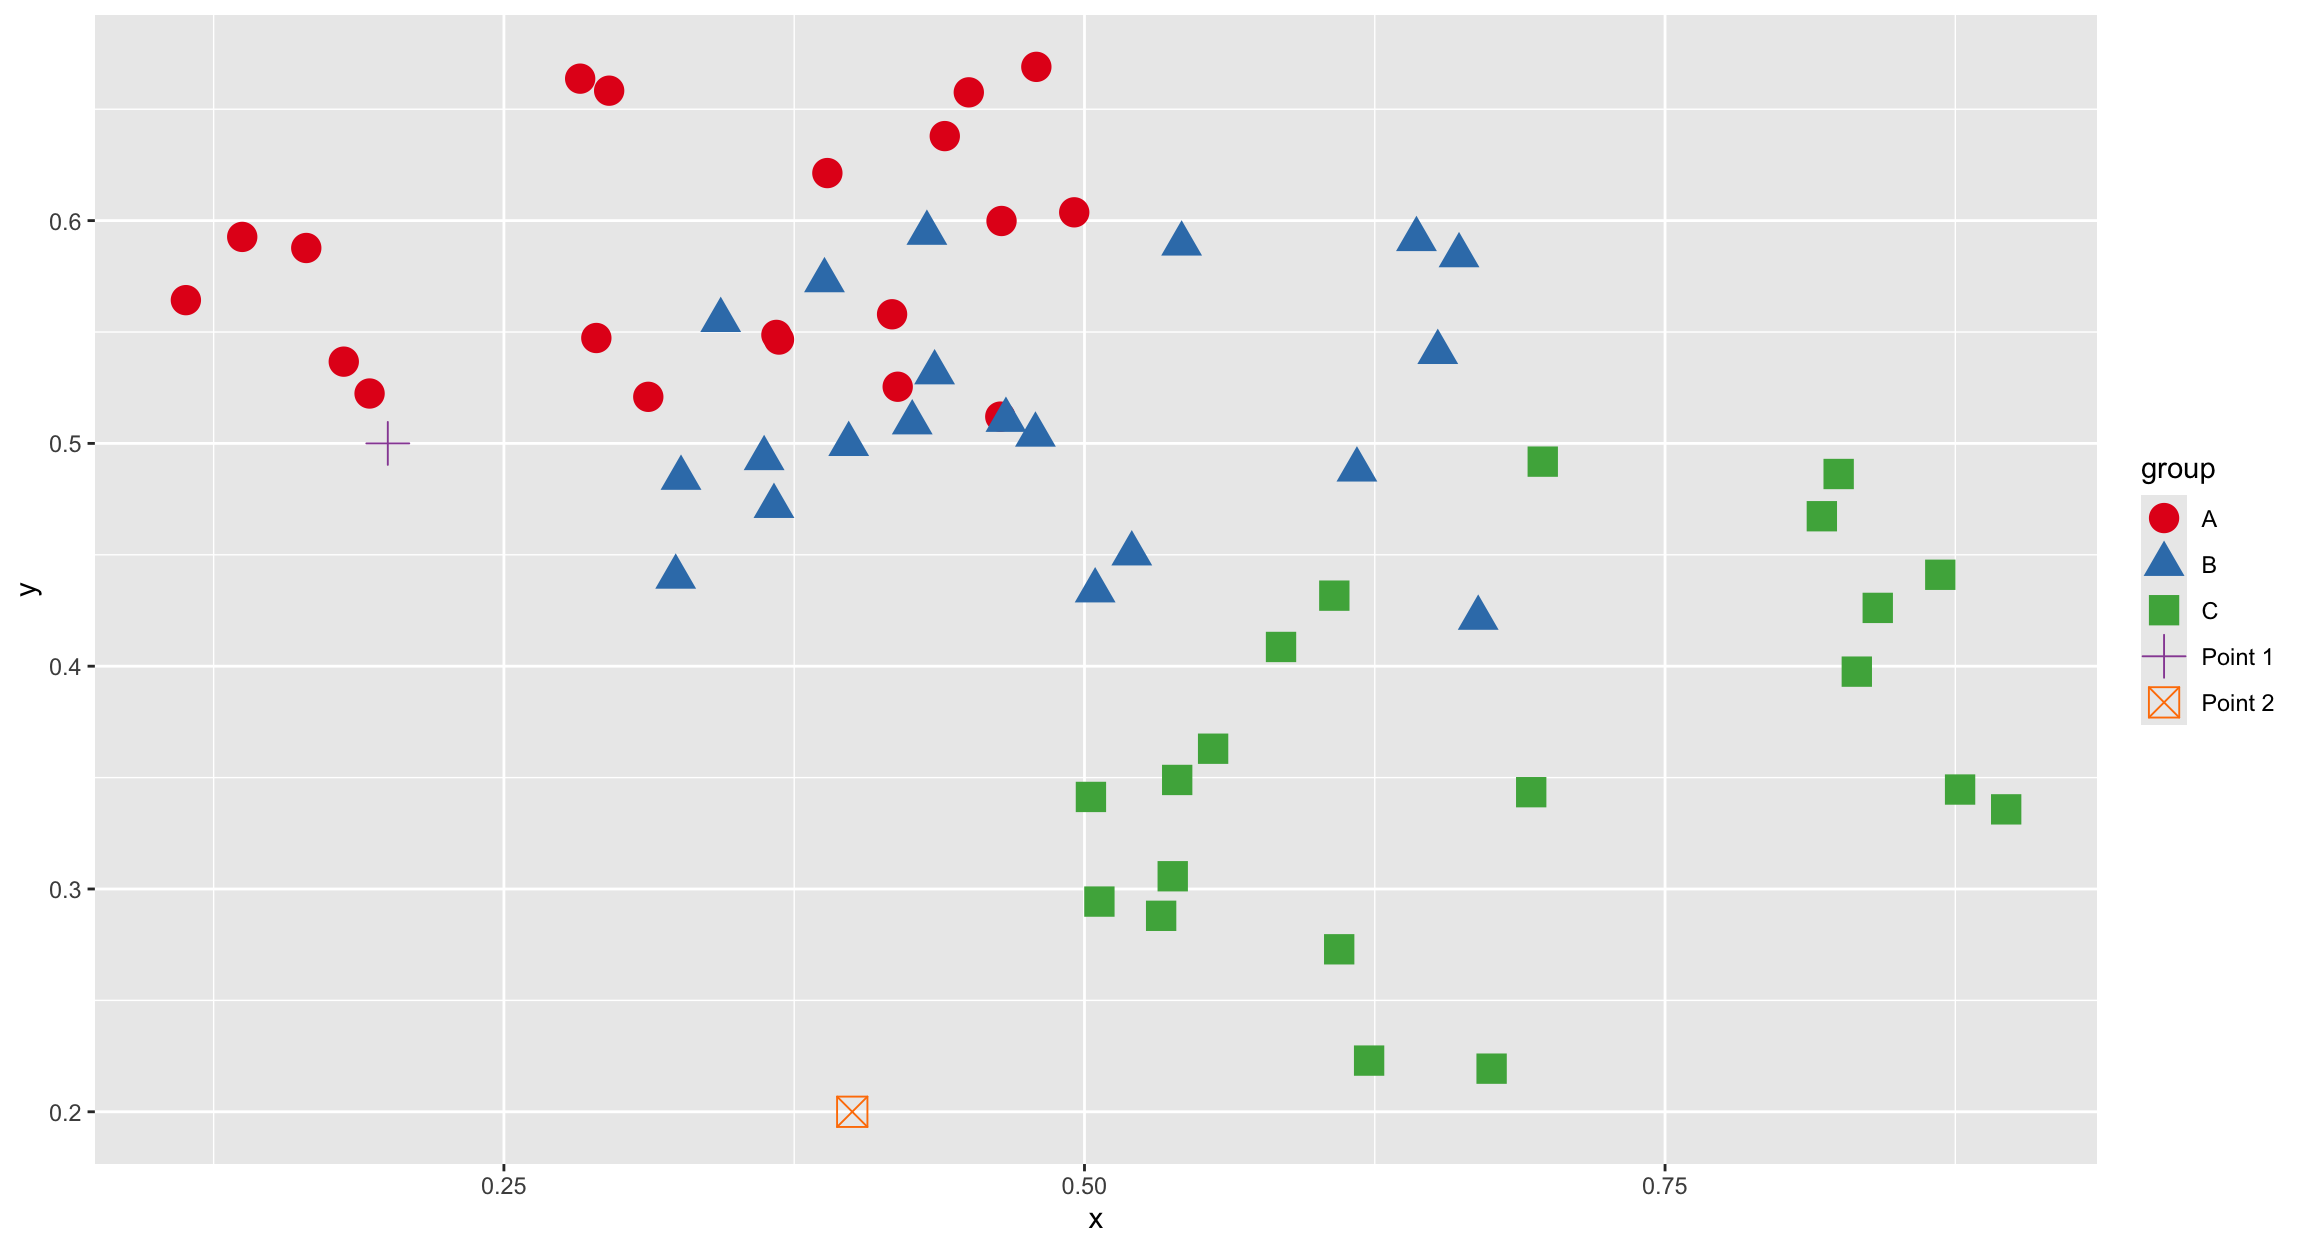
What if the data points belonged to three different groups, like this? How should a new data point, \((0.2, 0.5)\) be classified? What about \((0.4, 0.2)\)?
\(k\)-Nearest Neighbors
Bayes Classifier
A good classifier minimizes Testing Error (fraction of mis-classified observations)
- Bayes Classifier produce the lowest possible test error rate (proof)
Bayes Classifier assigns each observation to is most likely class using:
\[P(Y = j|X = x_0)\]
Problems:
We don’t know the conditional probability distribution, so we have to estimate it
(also, even if we did know the distribution, it could lead to overfitting)
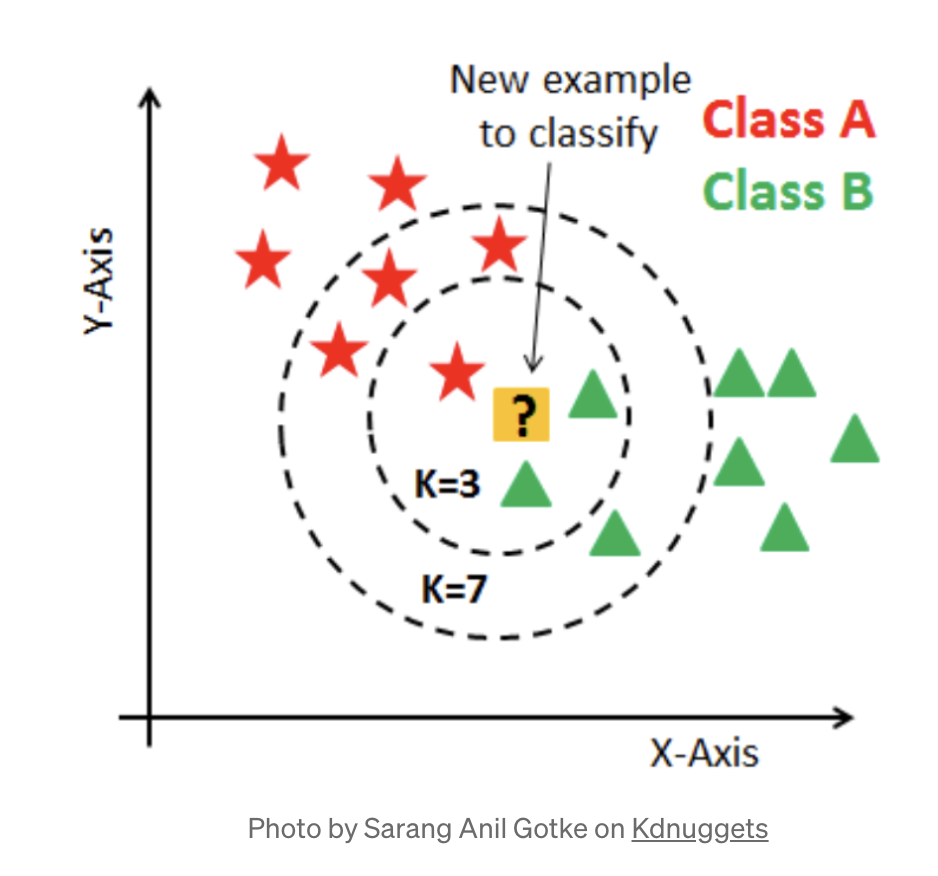
\(k\)-nearest neighbor (KNN) classifier:
A non-parametric supervised learning method that estimates the conditional probability.
Output: group membership of new point
if k = 3 -> A, if k = 7 -> B. Sensitive to \(k\)!
membership is most common among the closest \(k\) training points
Theoretically, if we choose \(k\) well, it becomes close to a Bayes classifier.
KNN classification algorithm
Input/set up: Training data is labeled
Algorithm: Given a new data point, these steps output its membership:
Choose a value for \(k\) (see note1)
find the \(k\) nearest neighbors to that point (from the training data)
From among those \(k\), count the # in each category
Assign new point based on plurality vote (i.e. the highest number)
knn() function
Example: Let’s classify our new points
\(k=2\)?
Advantages and Disadvantages of KNN
Advantages:
- It’s easy! (especially in
R!) - You don’t have to check any assumptions about the data
Disdvantages:
- Hard to decide \(k\) (typically, you’ll need to try several different values)
- Need \(n\) (number of observations) to be large relative to \(p\) (number of predictors)
- The geometry of the data affects the quality of fit (i.e. if the data is clustered, KNN does better)
- Because it uses distance, it only works with numeric predictors (unless we encode qualitative variables as dummy variables like in Linear Regression, which comes with its own geometry issues)
Choice of \(k\)
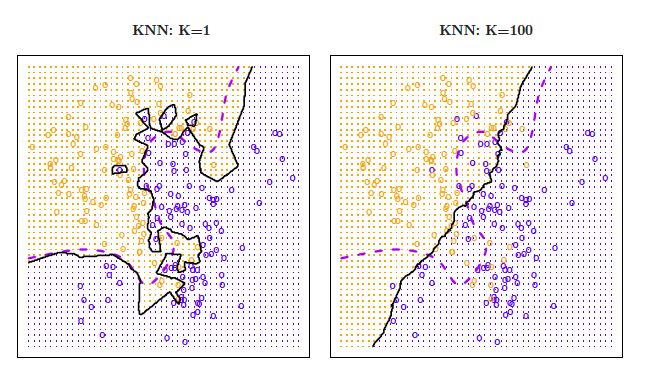
(in this example), \(k = 1\) leads to low bias (the boundary is close to the dashed purple line, which is the true boundary between classes), but high variance. On the other hand, \(k = 100\) leads to high bias (the boundary is far from the true boundary), but lower variance.
Examples
Example: Credit Utilization
Predict which utilization quantile a new customer falls into based on their application data (credit rating and age).
| Name | Age | Credit Rating |
|---|---|---|
| Lacey | 33 | 750 |
| Zach | 47 | 400 |
| Ashlee | 21 | 250 |
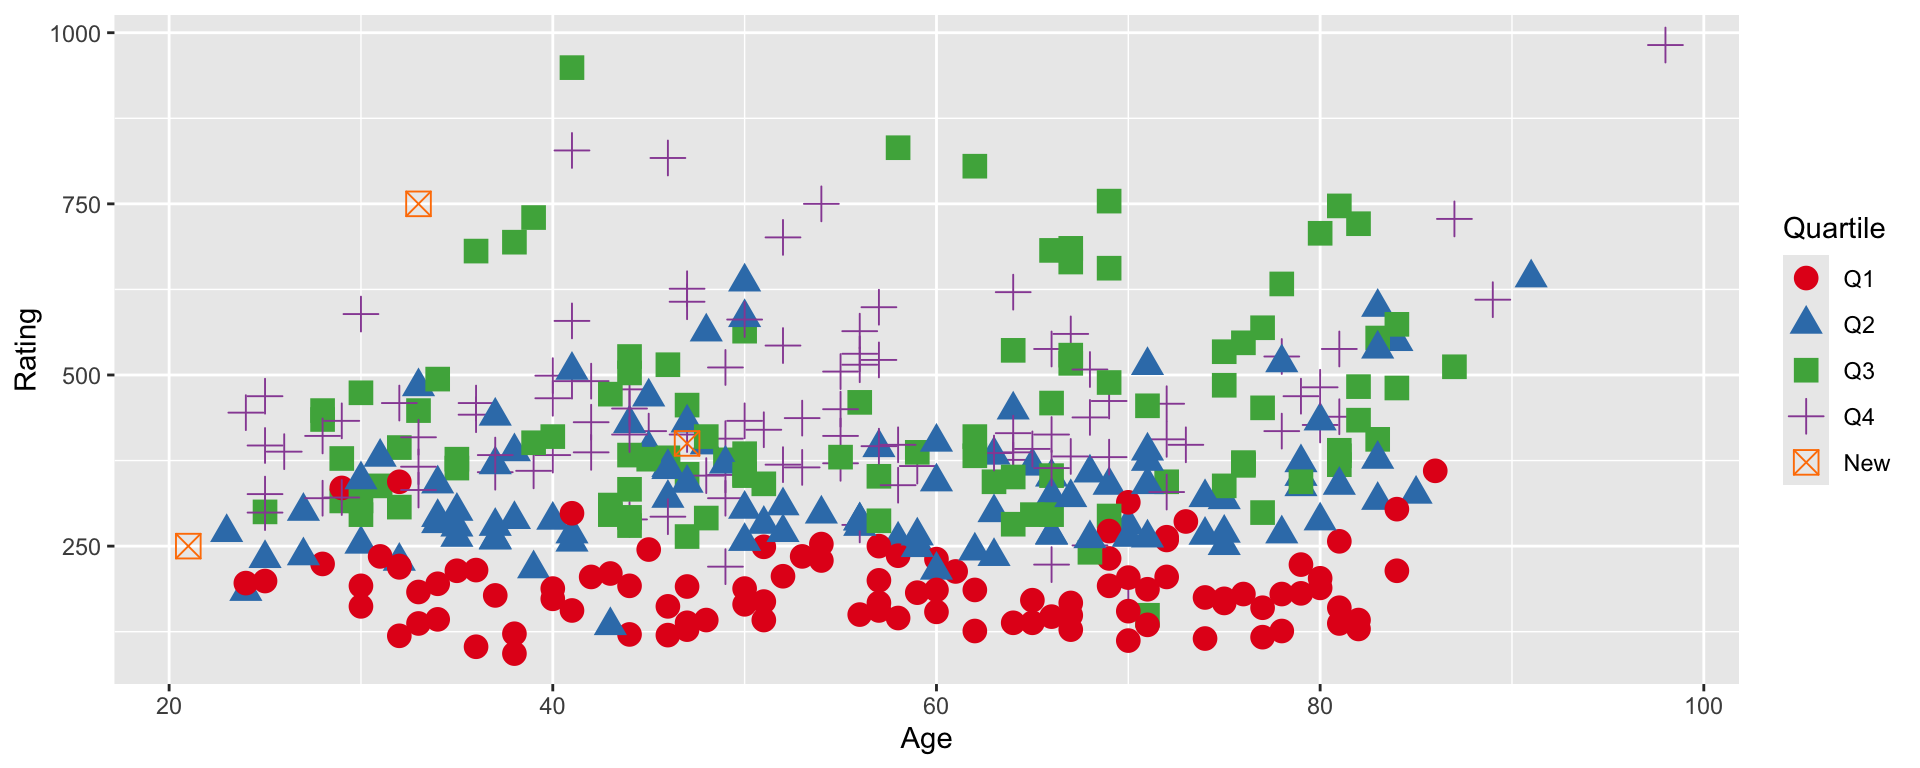
Example: Credit Utilization
\(k=20\)?
Model Evaluation
Example: Credit utilization
Is KNN an effective predictor of quartile using an applicant’s age, credit rating, income, number of existing credit cards, and education level?
Example: Credit utilization (cont)
Randomly selected 100 observations for testing, assigned the other 300 to training set.
set.seed(365)
test_ID = sample(1:nrow(Credit), size = 100)
TEST = Credit[test_ID,]
TRAIN = Credit[-test_ID, ]

#only select variables we want
knn_train = TRAIN %>% dplyr::select(Age, Rating, Income,
                                    Cards, Education)
knn_test = TEST %>% dplyr::select(Age, Rating, Income,
                                  Cards, Education)

knn50 = knn(train = knn_train,
            test = knn_test,
            cl = TRAIN$Quartile,
            k = 50, prob = TRUE)
knn50
[1] Q4 Q1 Q4 Q1 Q4 Q3 Q4 Q4 Q1 Q4 Q2 Q2 Q4 Q4 Q3 Q1 Q1 Q3 Q4 Q1 Q4 Q2 Q3 Q2 Q2
[26] Q4 Q3 Q4 Q4 Q2 Q2 Q2 Q3 Q2 Q1 Q4 Q4 Q3 Q3 Q2 Q1 Q2 Q3 Q4 Q1 Q4 Q3 Q2 Q4 Q4
[51] Q4 Q2 Q4 Q1 Q4 Q1 Q1 Q2 Q1 Q1 Q1 Q4 Q1 Q4 Q4 Q1 Q4 Q4 Q4 Q4 Q2 Q1 Q4 Q2 Q3
[76] Q2 Q2 Q1 Q1 Q4 Q2 Q4 Q2 Q3 Q2 Q4 Q1 Q4 Q4 Q2 Q4 Q4 Q4 Q4 Q2 Q2 Q4 Q2 Q1 Q2
attr(,"prob")
[1] 0.66 0.86 0.54 0.96 0.50 0.40 0.36 0.52 0.96 0.66 0.54 0.56 0.54 0.42 0.38
[16] 0.96 0.92 0.42 0.46 0.98 0.44 0.52 0.40 0.54 0.60 0.46 0.46 0.42 0.62 0.52
[31] 0.52 0.56 0.40 0.54 0.58 0.46 0.52 0.38 0.46 0.52 0.96 0.44 0.44 0.42 0.98
[46] 0.50 0.44 0.48 0.54 0.46 0.50 0.58 0.46 0.90 0.50 0.94 0.96 0.42 0.96 0.82
[61] 0.54 0.48 0.54 0.58 0.44 0.96 0.44 0.46 0.58 0.54 0.34 0.96 0.44 0.58 0.42
[76] 0.34 0.54 0.96 0.96 0.42 0.60 0.52 0.56 0.40 0.48 0.54 0.64 0.34 0.60 0.56
[91] 0.44 0.50 0.48 0.50 0.46 0.52 0.44 0.58 0.78 0.58
Levels: Q1 Q2 Q3 Q4Evaluation: Classification Accuracy
Now, we’ll set the testing data as “new data”, and make predictions using the k-nearest neighbors from the training data.
Try it yourself!
set.seed(365)
test_ID = sample(1:nrow(Credit), size = 100)
TEST = Credit[test_ID,]
TRAIN = Credit[-test_ID, ]

#only select variables we want
knn_train = TRAIN %>% dplyr::select(Age, Rating, Income,
                                    Cards, Education)
knn_test = TEST %>% dplyr::select(Age, Rating, Income,
                                  Cards, Education)

our_choice_of_k = 17

knnk = knn(train = knn_train,
            test = knn_test,
            cl = TRAIN$Quartile,
            k = our_choice_of_k, prob = TRUE)

t = table(knnk, TEST$Quartile)
sum(diag(t))/nrow(TEST)
[1] 0.61Caveats
Scaling Data
KNN for regression
KNN Regression algorithm
KNN can also predict quantitative responses - alternative to Linear Regression1
Choose a value for \(k\) (same as last time)
find \(k\) nearest neighbors (same as last time)
Response value for new point is average of the response values for the \(k\) nearest points (that is, \(f(x_0) = \frac1k \sum_{j=1}^k f(q_j))\), where the \(q_1,q_2,\dots,q_k\) are the \(k\) nearest training points)
Notes: Small \(k\) will perfectly interpolate the data, while large \(k\) will smooth the data
Example: Credit Utilization
[1] 0.157343839 0.011478125 0.144051032 0.005360386 0.142495141[1] 0.0386645Linear Regression vs KNN Regression
Parametric vs. nonparametric methods:
- If your model is correct (e.g. you are using linear regression to model a relationship that truly is linear), parameteric methods will outperform nonparametric every time.
Linearity:
- Many relationships in data are actually nonlinear, so KNN regression may outperform Linear Regression (e.g. the RMSE from KNN might be lower than from LR)
Curse of Dimensionality:
- Each observation is represented as a point in \(p\)-dimensional space (where \(p\) is the number of predictors). High-dimensional geometry is weird1, and in particular, when \(p\) is large, individual points will tend to be farther apart. As such, even if your data is nonlinear, Linear Regression may do better than KNN when \(p\) is large.